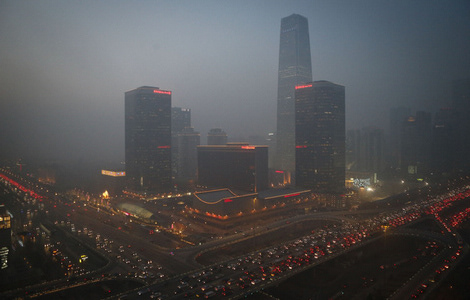
PM 2.5 is severe in Beijing. Photo credit: China Daily
COGS109 Data Analysis and Modeling was a project-based class that I took in summer 2017. The course provided exposure to the basic computational methods useful throughout cognitive science. Computing basic statistics, modeling learning individuals, evolving populations, communicating agents, and corpus-based linguistics will be considered. The final project of this course was a team-based project on performing regression or clustering model analysis on a large dataset, and to make predictions of the relationships between indicators.
Abstract
Four models that predict the PM2.5 values in Beijing are shown in this report. Linear regression, a powerful technique used for predicting the unknown value of a variable from the known value of another variable, is used in this project. Statistics are generated from the available adaptation data and used to calculate linear regression models from predicted weight of different attributes in the UCI dataset. Each model is trained by 80% of the data and validated by 20% of the data from the dataset. By comparing SSE(Sum of Square Error) of different models, the model with smallest SSE is chosen to be the best model that predicts the PM2.5 in Beijing.
Introduction
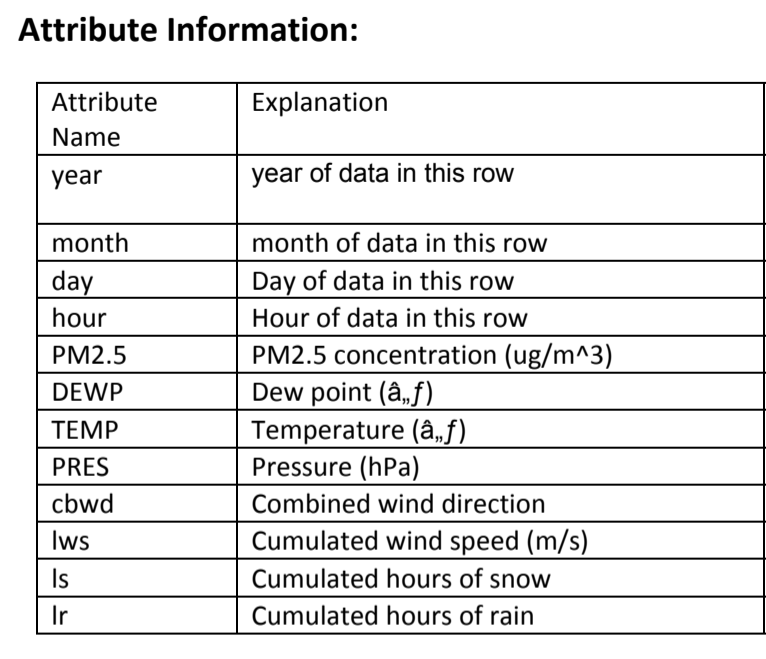
Our group project is analyzing the PM2.5 value of Beijing over 4 years (2010-2014). The dataset is a flat table with 13 attributes and 43824 instances. Each entry of data is composed with 12 potential influential attributes and a corresponding PM2.5 value. Each entry stands for an hour’s measurement of one day, and starting from 1st Jan 2010 to 31st Dec 2014. We identify the problem as predicting the PM2.5 value with some combination of these 12 attributes with a regression model.
Dataset Information
Air quality is becoming a worldwide concern. The hourly data set we chose comes from University of California, Irvine Machine Learning Repository, which contains the PM2.5 data of US Embassy in Beijing. Meanwhile, meteorological data from Beijing Capital International Airport are also included.
The whole data set contains 43824 instances and 13 attributes, which includes row number, year, month, day, hour, PM2.5 concentration (ug/m^3) (output), dew Point (℃), temperature (℃), pressure (hPa), combined wind direction, cumulated wind speed (m/s), cumulated hours of snow, cumulated hours of rain.
Research Question
Our research question is that how do factors like temperature, hour of the day, dew point, pressure etc. influence the concentration of PM2.5 in Beijing? Can we build accurate models to predict the concentration of PM2.5 in Beijing by using these factors as predictors?
Methodology
Considering that PM2.5 is a continuous output, and the dataset has several attributes which can be used as inputs, we determined that multivariable linear regression would be suitable models with this dataset.
Regression Model
Model 1
PM2.5=W0 + W1*hour + W2*DEWP + W3*PRES + W4*IWS
Predictors: Constant, Dew Point, Temperature, Pressure, Cumulated Wind Speed
PM2.5=W0 + W1*hour + W2*DEWP + W3*PRES + W4*IWS
Predictors: Constant, Dew Point, Temperature, Pressure, Cumulated Wind Speed
Model 2
PM2.5=W0 + W1*DEWP + W2*TEMP + W3*PRES + W4*IWS + W5*ls^2 + W6*lr^2
PM2.5=W0 + W1*DEWP + W2*TEMP + W3*PRES + W4*IWS + W5*ls^2 + W6*lr^2
Predictors: Constant, Dew Point, Temperature, Pressure, Cumulated Wind Speed, cumulated hours of snow^2 , cumulated hours of rain^2.
Model 3
PM2.5= W0 + W 1* PRES + W2 *TEMP^2 + W3 *IWS^3 + W4 *DEWP
Predictors: Constant, Pressure, Temperature^2 , Cumulated Wind Speed3^, Dew Point
PM2.5= W0 + W 1* PRES + W2 *TEMP^2 + W3 *IWS^3 + W4 *DEWP
Predictors: Constant, Pressure, Temperature^2 , Cumulated Wind Speed3^, Dew Point
Model 4
PM2.5 = W0*TEMP + W1*DEWP +W2*IWS + W3 (Based on the “Season” the model determines) + W4*PRES +W5*PRES^2
Predictors: Constant, Temperature, Dew Point, Pressures, Cumulated Wind Speed, Season, Pressure^2
PM2.5 = W0*TEMP + W1*DEWP +W2*IWS + W3 (Based on the “Season” the model determines) + W4*PRES +W5*PRES^2
Predictors: Constant, Temperature, Dew Point, Pressures, Cumulated Wind Speed, Season, Pressure^2
Errors/Results
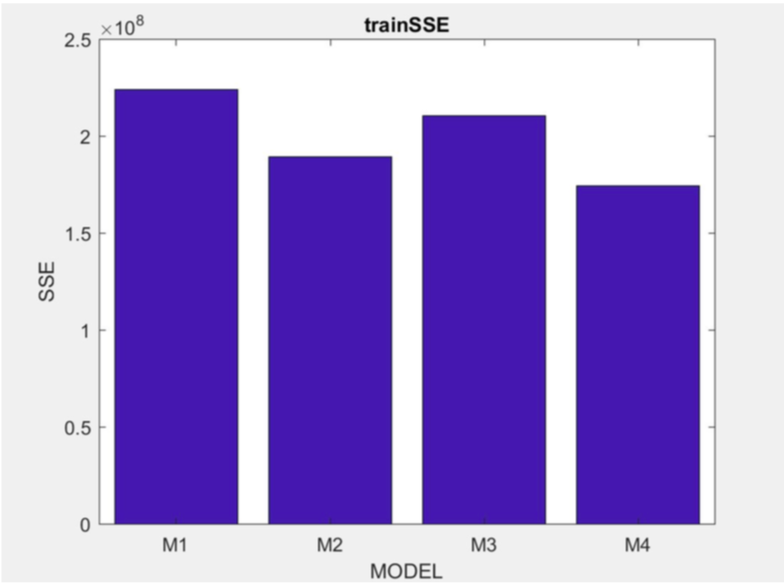
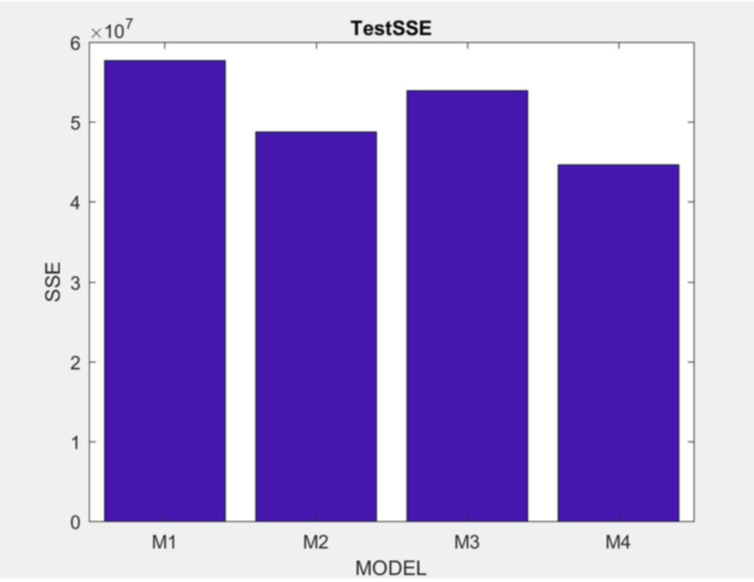
Model 1 train SSE: 2.2413e+08 Model 1 test SSE: 5.7710e+07
Model 2 train SSE: 1.8926e+08 Model 2 test SSE: 4.8773e+07
Model 3 train SSE: 2.1064e+08 Model 3 test SSE: 5.3930e+07
Model 4 train SSE: 1.7431e+08 Model 4 test SSE: 4.4634e+07
Conclusion
From existing 4 models, predictors in model 2 and 4 are relatively more accurate (has lower SSE values), which specifically takes factors like cumulated hours of snow , cumulated hours of rain , and season into account. Therefore, it is our conclusion that PM2.5 in Beijing is correlated with these attributes.
These models are helpful in future prediction of PM2.5 concentration in Beijing.
Future related work with this dataset or PM2.5 research should consider measure attributes like sociological factors, such as how many factories are around measuring area with gas emissions.
Reference
Song Xi Chen, 2017. Beijing PM2.5 Data Data Set, University of California, Irvine, Machine Learning Repository. https://archive.ics.uci.edu/ml/datasets/Beijing+PM2.5+Data#
Final Project Poster
Special Thanks to my teammates:
Shangyuan Tong
Yujie Wang
Xinyi Yang